Concept · How your list is built
You don't build a dashboard. The system builds your list.
A traditional BI tool hands you a canvas and a chart library. You decide what to put on the screen, where, and in what order — and then you do it again next quarter. The tool is neutral; the prioritizing is your job.
Performix works the other way. There is a pool of precomputed findings about your teams, and the product ranks them — generally, and then for you specifically — so the first thing you see is the thing most worth your attention. It's closer to how a search engine ranks results than to how a dashboard lays out tiles. The hard part isn't drawing the chart. It's deciding which one you should be looking at.
01 · The shift
Yahoo organized the web by hand. Google ranked it. We made the same move for analytics.
See the proofHide
01 · The shift
Yahoo organized the web by hand. Google ranked it. We made the same move for analytics.
Every person gets a list ranked from the same objective index, then tuned to them — with one rule a recommender doesn't have: the worst problems can't be tuned away.
Early web directories were curated: a person decided which sites belonged in which category, and maintained the page. It didn't scale, it went stale, and it was the same for everyone. Ranked search replaced it — for any query, score everything and return an ordered list, tuned to the searcher.
Most performance reporting is still the curated directory: a fixed dashboard someone built, the same for every viewer, going stale between refreshes. Performix is the ranked-list move. We hold the universe of findings, score each one, and order them — so the list reorders itself as the data changes and as you act on it.
That's why the experience feels different from BI. You're not maintaining a page. You're being handed the next thing to look at.
02 · The four layers
From a pool of findings to the list in front of you.
See the proofHide
02 · The four layers
From a pool of findings to the list in front of you.
Layer 0 — the gate. A finding only enters the ranking if it clears a standard: enough responses to be safe to show, reliable enough to trust, and material enough to matter. Everything below the bar is held back, with the reason recorded — nothing is silently dropped.
Layer 1 — the general index. Everything that clears the gate gets one shared 0–100 score, the same for everyone, built from four parts: how much it moves performance value, how far it sits from the benchmark, how confident the measurement is, and whether there's a lever to pull. This is the objective spine — two people looking at the same team agree on what's objectively most important before any personalization.
Layer 2 — personalization. Then the list tunes to you: your role and focus, and what you've acted on or set aside before. Your list and a colleague's start from the same spine and diverge from there.
Layer 3 — assembly. Finally it's assembled with a little diversity and a small exploration budget, so the list doesn't collapse onto a single theme and quietly hide everything else.
03 · The floor
A severe problem is never buried because you keep dismissing it.
See the proofHide
03 · The floor
A severe problem is never buried because you keep dismissing it.
A recommender optimizes for what you'll engage with. Dismiss a topic enough and it learns to stop showing it. For entertainment that's correct. For a diagnostic it's dangerous — the whole value is surfacing the binding constraint a leader is ignoring.
So personalization has a floor. It can reorder your list freely, but it can't bury a finding above a severity threshold. A serious problem keeps surfacing even after you've set it aside — flagged that you've seen it before, not silently removed.
It's a small rule with a large consequence: the product optimizes for what you need to see, not for what you'll click.
04 · In the product
The list, playing back.
See the proofHide
04 · In the product
The list, playing back.
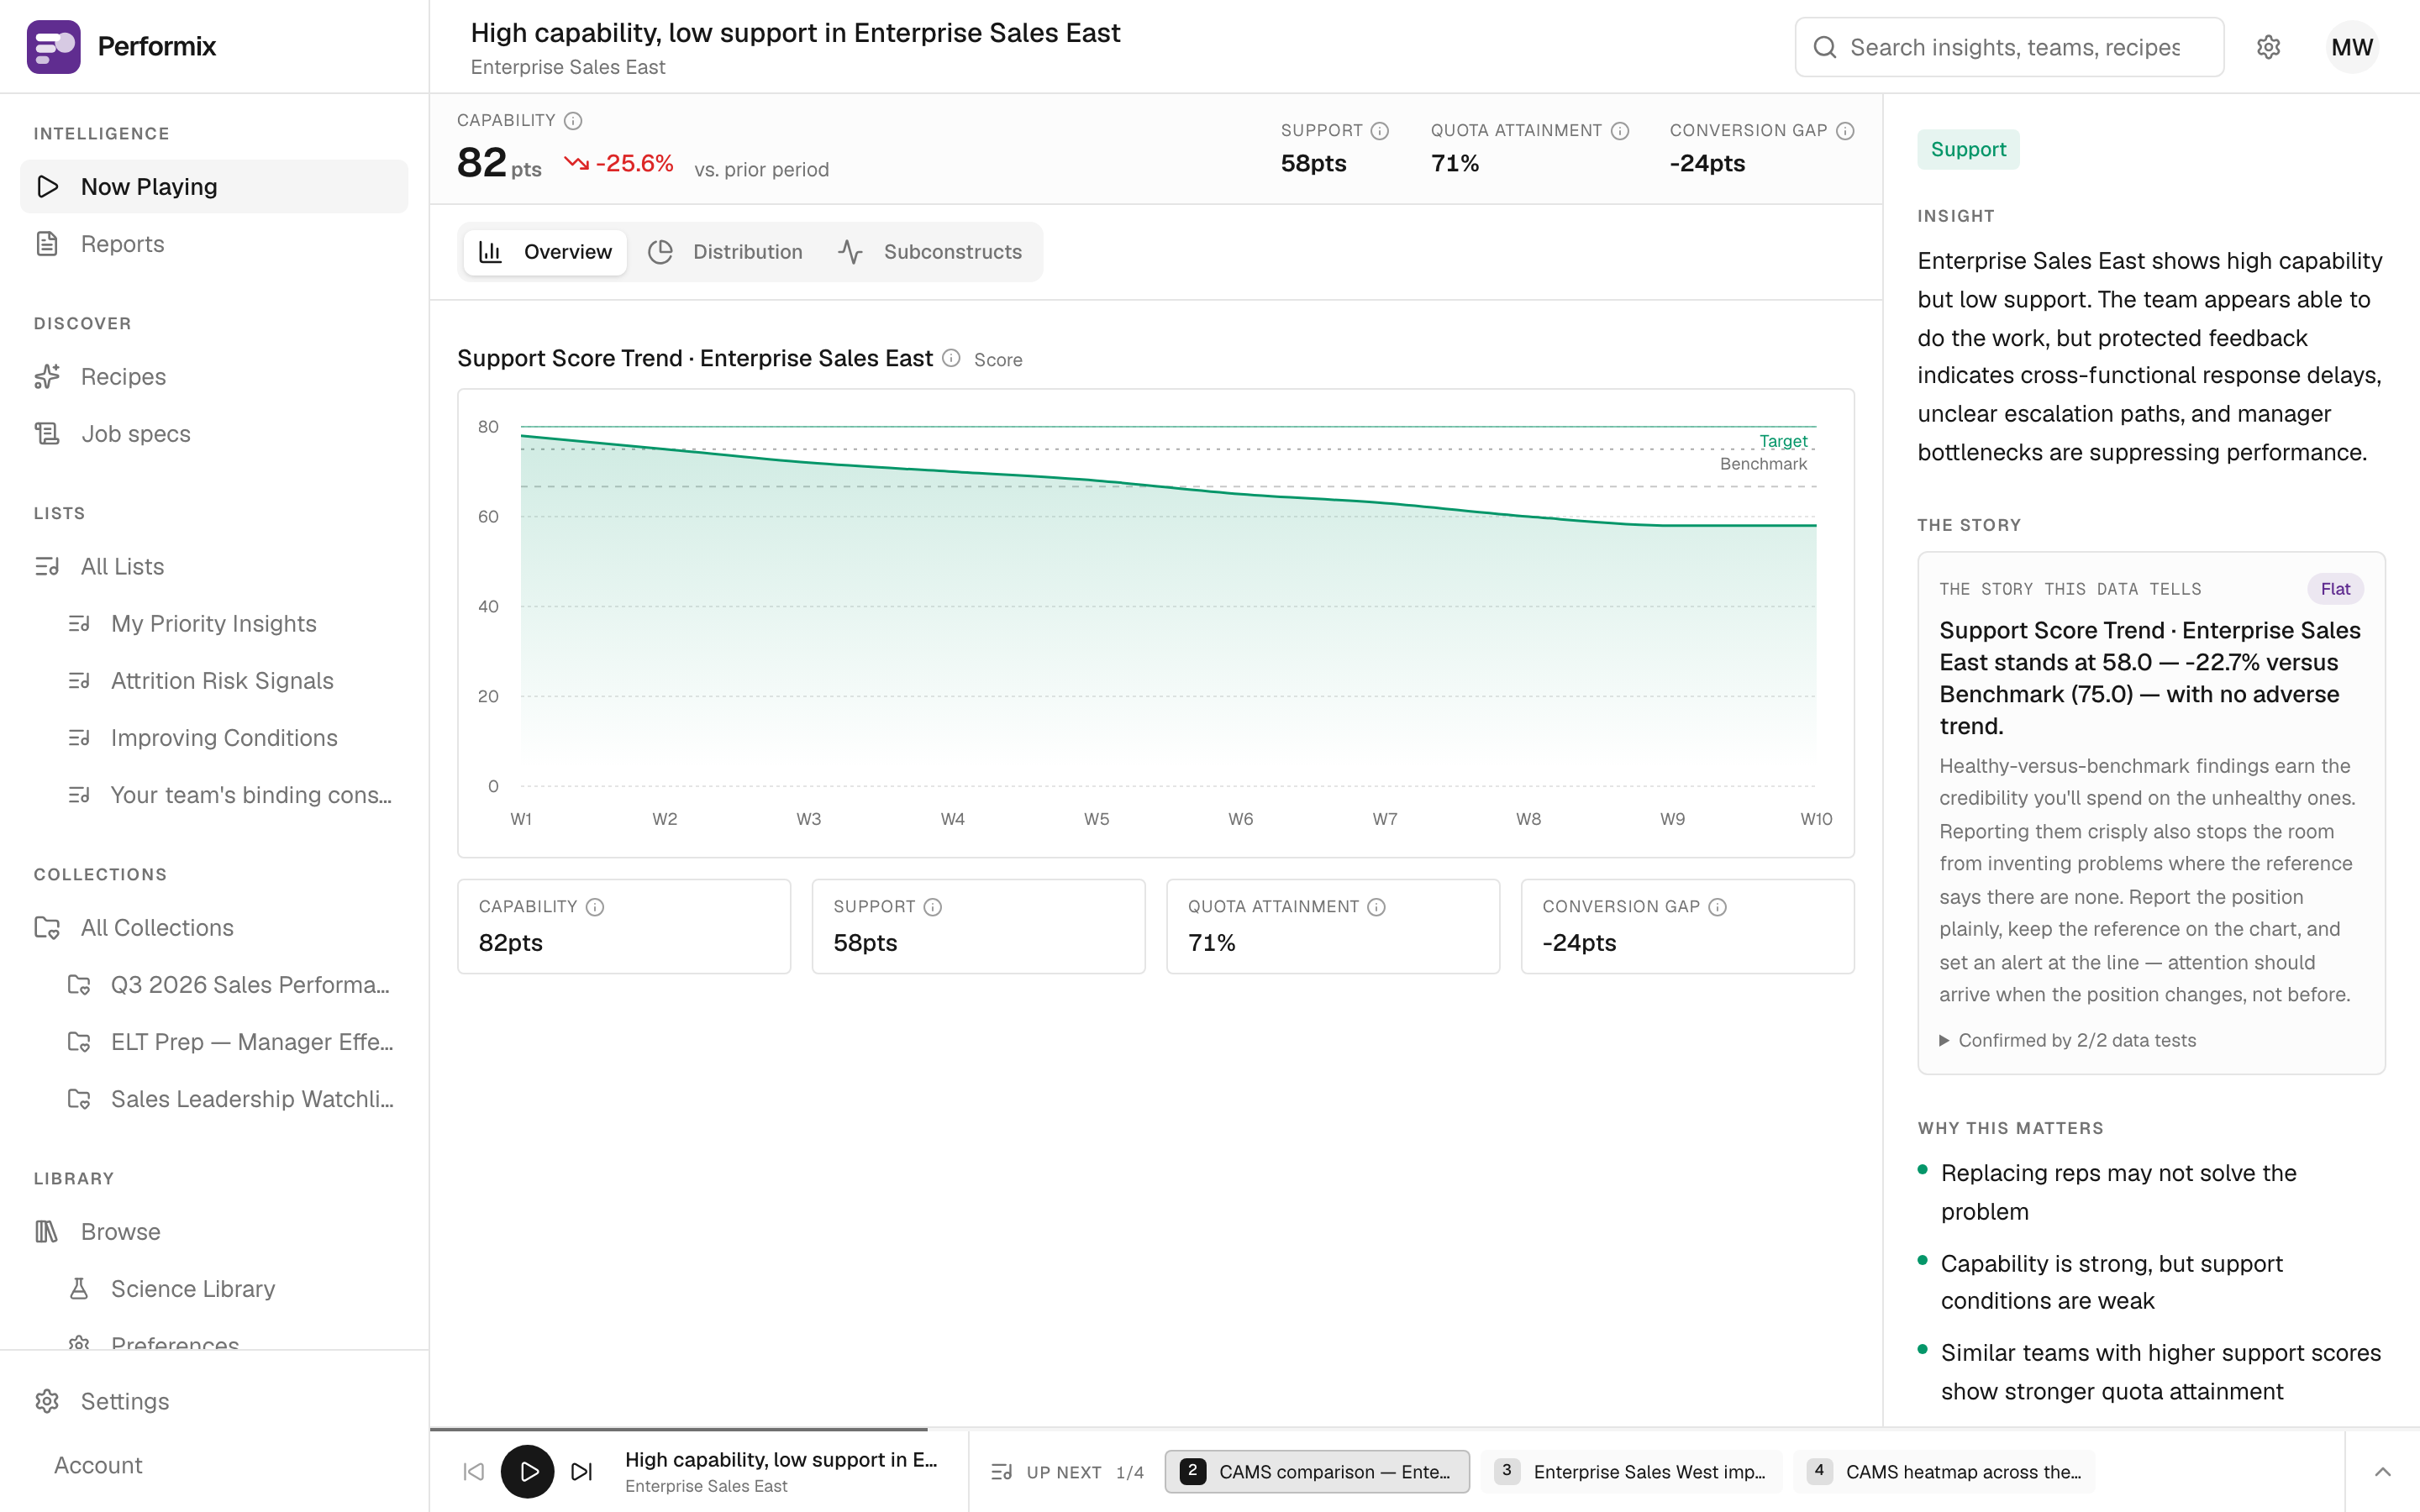
Each finding renders as a card: the one condition holding a team back, the evidence behind it, a safety status, and a recommended action. The cards are precomputed and stored, then played back in ranked order — nothing is generated while you wait.
The ranking is shared infrastructure: the same engine orders what you browse and answers what you ask (see Ask Your Data). Browsing is the ranked list with no question; asking is the ranked list with one.